

Introduction
Modern cloud-native software deployments are defined by distributed complexity. Ephemeral container instances, serverless functions, and asynchronous microservices generate immense telemetry velocity that overwhelms traditional human-driven investigation. During a major platform outage, human operators rarely suffer from a lack of data; instead, they face a wall of uncoordinated, low-signal telemetry emitted across multiple isolated dashboards.
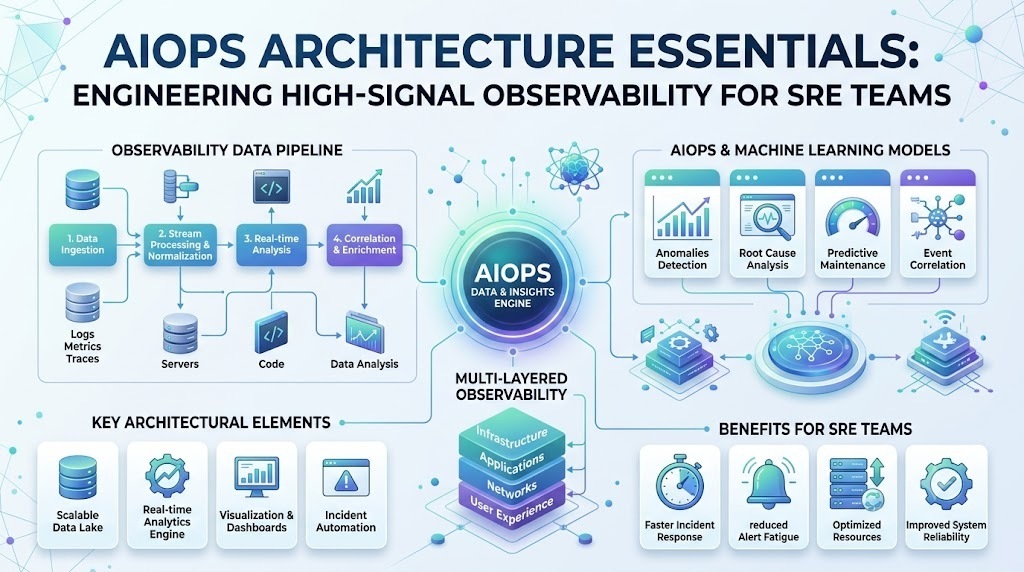
An AIOps architecture functions as an intelligent control plane that orchestrates these disparate data streams. Rather than simply centralizing logs and metrics, an AIOps framework ingests, enriches, and correlates telemetry in real time using statistical baselining, graph dependency structures, and policy-governed automation pipelines. This systemic approach transforms fragmented operational noise into prioritized causal pathways, enabling Site Reliability Engineering (SRE) and DevOps teams to uphold strict Service Level Objectives (SLOs). Educational resources such as TheAIOps help bridge the gap between abstract AI concepts and practical, hands-on operational engineering.
Rethinking the Operational Control Loop
Traditional IT Operations relied on reactive, boundary-driven monitoring—evaluating isolated signals against fixed, manual thresholds (such as triggering an alert when disk utilization crosses 90%). In elastic, auto-scaling environments, such rigid conditions fail to reflect normal operational fluctuations, leading directly to alert saturation and operational friction.
+-------------------------------------------------------------------------+
|                  AIOPS PIPELINE ARCHITECTURE PROCESS                    |
+-------------------------------------------------------------------------+
| 1. TELEMETRY CAPTURE     Metrics | Logs | Traces | Topology | Events    |
+-------------------------------------------------------------------------+
                                    |
                                    v
+-------------------------------------------------------------------------+
| 2. STREAM & STORAGE      Kafka Streams | OpenSearch | Time-Series DBs   |
+-------------------------------------------------------------------------+
                                    |
                                    v
+-------------------------------------------------------------------------+
| 3. ANALYTIC PROCESSING   Dynamic Baselines | Alert Grouping | Causality |
+-------------------------------------------------------------------------+
                                    |
                                    v
+-------------------------------------------------------------------------+
| 4. DISPATCH & RESPONSE   ChatOps | ITSM Pipelines | Automated Runbooks  |
+-------------------------------------------------------------------------+
                                    |
                                    v
+-------------------------------------------------------------------------+
| 5. GOVERNANCE & AUDIT    Human Approval | Policy Checks | Event Logs    |
+-------------------------------------------------------------------------+
An AIOps system replaces rigid threshold logic with continuous behavioral inference. By constructing dynamic statistical envelopes around operational metrics, the system automatically adapts to cyclical traffic shifts, maintenance windows, and routine system scaling.
Core Structural Domains of an AIOps Architecture
A resilient AIOps platform relies on five decoupled operational domains. Each domain transforms raw telemetry into increasingly refined operational context.
   [ Raw System Telemetry ]
 (Logs, Metrics, Traces, Events)
                |
                v
  +---------------------------+
  | Ingestion & Streaming     |  (OpenTelemetry, Vector, Kafka)
  +---------------------------+
                |
                v
  +---------------------------+
  | Storage & Topology Engine |  (TSDBs, Document Stores, Graph DBs)
  +---------------------------+
                |
                v
  +---------------------------+
  | Analytical ML Engine      |  (Isolation Forests, Clustering, RCA)
  +---------------------------+
                |
                v
  +---------------------------+
  | Orchestration & Action    |  (PagerDuty, ServiceNow, Ansible)
  +---------------------------+
                |
                v
    [ Human Engineering Team ]   (Validation, Policy Oversight, Rules)
1. Unified Telemetry Capture
The entry domain ingests heterogeneous telemetry across all operational boundaries:
- Metrics: Time-stamped numerical data measuring resource allocation, throughput, latency, and error counts.
- Logs: Event-driven text outputs emitted by container runtimes, application frameworks, and system kernels.
- Distributed Traces: Unique request-path identifiers that record latency and call stacks across microservice boundaries.
- System Topology: Living structural state maps detailing dependencies across physical nodes, virtual networks, and managed services.
Leveraging open standards like OpenTelemetry decouples data collection from backend vendor platforms, providing a flexible schema across heterogeneous infrastructures.
2. Stream Processing & Storage Fabrics
Raw telemetry streams require real-time parsing, context enrichment, and specialized storage routing:
- Time-Series Engine: Optimized for rapid ingestion and downsampling of high-cardinality metrics (e.g., Prometheus, VictoriaMetrics).
- Document & Search Clusters: Scaled to index semi-structured log streams for fast text search (e.g., OpenSearch).
- Graph Databases: Purpose-built to maintain live service-dependency relationships (e.g., Neo4j), providing the structural context required for topological correlation.
3. Machine Learning Analytical Core
This layer runs algorithmic evaluations on unified data streams:
- Dynamic Anomaly Detection: Applies unsupervised statistical learning (such as Autoencoders or Isolation Forests) to detect significant deviations without manual threshold configuration.
- Alert Compression & Deduplication: Uses natural language processing and temporal clustering to group related alert events into unified incident contexts.
- Causal Graph Traversal: Analyzes structural topology alongside time-series anomaly sequences to determine probable failure domains.
4. Incident Routing & Notification
Validated incidents are pushed directly into existing operational workflows:
- Contextual Alerting: Delivers deduplicated, context-rich alerts to on-call management tools like PagerDuty or Opsgenie.
- ITSM Pipeline Sync: Creates, updates, and tracks ticket lifecycles within platforms like ServiceNow or Jira Service Management.
- ChatOps Interface: Exposes real-time topology maps and execution options directly inside engineering communication channels like Slack or Microsoft Teams.
5. Policy-Governed Remediation
When well-defined, low-risk operational failures occur, the execution engine triggers automated mitigation routines (such as clearing ephemeral caches, cycling unhealthy pods, or executing Ansible playbooks) subject to strict runtime policies and human approval steps.
Machine Learning Capabilities in AIOps
AIOps platforms apply distinct machine learning approaches based on the operational context.
+---------------------------------------------------------------------+
|                      AIOPS MACHINE LEARNING ROLES                   |
+---------------------------------------------------------------------+
| Dynamic Anomaly Detection  ->  Isolation Forests, Autoencoders      |
| Cross-System Alert Grouping ->  Temporal Clustering, Graph Analytics |
| Predictive Maintenance     ->  ARIMA, Prophet, LSTM Networks        |
| Causal Troubleshooting     ->  Topological Path Analysis            |
+---------------------------------------------------------------------+
Adaptive Behavioral Baselining
Static alerts treat every resource spike identically. Unsupervised learning models evaluate continuous metric streams against historical norms to establish fluid performance bands.
For example, an isolated CPU surge during a scheduled database index rebuild is recognized as baseline behavior, whereas an identical CPU surge during a low-traffic window triggers an anomaly signal.
Algorithmic Alert Compression
Major system outages can trigger thousands of downstream alerts in seconds. The analytical engine mitigates alert fatigue through three distinct steps:
- Deduplication: Merges identical, high-frequency alerts occurring within tight time windows.
- Temporal Windowing: Correlates disparate event signals firing concurrently across related sub-systems.
- Topological Mapping: Cross-references active alerts against live graph models to confirm they share an underlying infrastructure dependency.
Capacity Forecasting
Supervised forecasting models (such as Prophet or LSTM networks) analyze time-series trends to project future resource exhaustion. By identifying storage or memory depletion trajectories well before critical limits are reached, platform teams can execute maintenance tasks proactively without impacting users.
Architectural Comparison: Traditional vs. AIOps Control Planes
| Architectural Dimension | Traditional Monitoring | Modern AIOps Architecture |
|---|---|---|
| Data Architecture | Siloed collection per tier (Database, Network, Compute) | Unified ingestion pipeline accepting metrics, logs, traces, and topology |
| Detection Logic | Static thresholds (e.g., Alert if CPU > 85%) | Dynamic statistical baselines adapting to workload cycles |
| Signal-to-Noise Ratio | Low; high false-positive rates and alert fatigue | High; automated deduplication and incident grouping |
| Troubleshooting Path | Manual log parsing across disjointed interfaces | Algorithmic causality scoring over active topology graphs |
| Operational Stance | Reactive; manual intervention for all incidents | Proactive forecasting with policy-governed remediation workflows |
| Primary Metric Focus | Host-level uptime and hardware resource health | End-to-end service reliability, user experience, and SLO targets |
Practical Architectural Scenarios
Scenario 1: Resolving Cascading Failures in Microservices
An unannounced configuration change limits memory allocations on an internal API gateway instance. Within three minutes, 20 dependent microservices encounter connection timeouts, generating over 300 distinct alerts across separate monitoring tools.
[ Unannounced Config Change Limits Gateway Memory ]
                        |
                        +--> (20 Microservices experience timeout errors)
                        |
                        +--> (300+ Disparate Alerts triggered in monitoring)
                        |
                        v
   [ AIOps Ingestion & Processing Pipeline ]
                        |
 (Applies Temporal Clustering & Topological Pathing)
                        |
                        v
   [ Single Actionable Incident Ticket ]
   - Suspected Source: Internal API Gateway Memory Allocation Limit
   - Scope: 20 Downstream Microservices Impacted
   - Action Suggested: Revert Gateway Config to Last Known Good State
- Traditional Handling: The on-call engineer receives hundreds of pages from individual microservice repositories, spending significant time manually tracing dependency paths back to the gateway.
- AIOps Architecture Handling: The streaming engine correlates incoming alert events using temporal alignment and dependency graph analysis. It collapses the 300 alerts into a single incident card: "High Confidence Root Cause: Gateway Memory Allocation Limit impacting 20 downstream services."
Scenario 2: Automated Storage Remediation via Predictive Analytics
A misconfigured application process leaks temporary files onto a local ephemeral disk partition at a rate of 10 GB per hour.
- Detection: A time-series forecasting model detects the steady consumption slope, calculating that disk capacity will be fully exhausted in 6 hours—well before static 90% threshold alerts fire.
- Remediation: The platform automatically logs an issue in the ITSM system, alerts the platform team, and executes a validated workflow script to purge temporary files older than 24 hours, resolving the capacity threat without service disruption.
Step-by-Step AIOps Implementation Strategy
Successfully deploying an AIOps control plane requires a structured strategy focused on data hygiene before enabling automated response mechanisms.
Step 1: Audit & Clean Telemetry Interfaces
   |
   v
Step 2: Unify Ingestion Pipelines (OpenTelemetry)
   |
   v
Step 3: Enable Dynamic Baselines & Deduplication Rules
   |
   v
Step 4: Connect Topology Mapping Engine
   |
   v
Step 5: Roll Out Guardrailed Automated Playbooks
Step 1: Telemetry Health Assessment
Audit existing monitoring assets to ensure consistent log schemas, appropriate metric collection intervals, and tracing coverage. Standardize metadata tags across all operational components (such as environment, service_owner, and region).
Step 2: Standardize Open Data Ingestion
Deploy unified collector agents (such as OpenTelemetry Collectors) to manage metrics, logs, and traces through a single pipeline. Standardizing ingestion prevents vendor lock-in and simplifies downstream data enrichment.
Step 3: Implement Dynamic Baselining
Connect ingestion pipelines to the analytics engine to deploy dynamic baselining and alert deduplication. Measure alert volume reductions to establish baseline accuracy and minimize false positives.
Step 4: Integrate Topology Engines
Incorporate dynamic infrastructure dependency maps from cloud provider APIs, container orchestrators (such as Kubernetes), and configuration management databases. Topology context enables accurate root-cause identification.
Step 5: Introduce Policy-Governed Automation
Identify repetitive, low-risk operational tasks suitable for automated response. Write execution playbooks guarded by strict rate-limiting policies, approval gates, and automatic rollback routines.
Governance, Security, and Risk Management
Integrating machine learning into core IT operations control planes requires strict administrative controls:
- Telemetry Scrubbing & PII Redaction: Ingestion agents must scrub sensitive data—such as user credentials, API tokens, and personally identifiable information (PII)—before storing data or sending it to analytical models.
- Human-in-the-Loop Safeguards: High-impact remediation actions (such as restarting production database nodes or altering routing tables) must require explicit confirmation from on-call engineers via ChatOps or ITSM workflows.
- Immutable Decision Logging: Every automated action, model evaluation, and confidence score must be recorded in an immutable audit trail for post-incident review and regulatory compliance.
- Model Validation & Drift Monitoring: Machine learning models degrade over time as application architectures evolve. Continuously evaluate anomaly detection accuracy, false-positive rates, and model drift to maintain operational trust.
Common Architectural Pitfalls
- Ingesting Low-Quality, Unstructured Data: Feeding unparsed, unstandardized logs into machine learning models generates poor correlation results. High telemetry hygiene is essential for accurate algorithmic outputs.
- Over-Reliance on Unvalidated ML Models: Treating AI correlation outputs as absolute truth without human oversight can lead engineers down wrong troubleshooting paths during atypical edge-case failures.
- Uncontrolled Automation Execution: Triggering automated remediation playbooks without rate limits or safety checks can worsen outages. For example, an automated loop designed to restart unhealthy pods might overload the cluster control plane if left unchecked.
- Attempting Full Automation Too Early: Trying to deploy end-to-end automated remediation immediately often leads to configuration errors. Successful organizations start with alert noise reduction and gradually build toward automated workflows as model accuracy is verified.
AIOps Platform Evaluation Framework
Use this evaluation checklist when selecting an AIOps vendor platform or designing an internal solution:
- Telemetry Ingestion: Does the system natively ingest OpenTelemetry data alongside legacy log formats and cloud infrastructure metrics?
- Streaming Scalability: Can the pipeline process high telemetry bursts during major incidents without dropping events or adding processing latency?
- Model Explainability: Does the platform clearly explain the logic behind its root-cause diagnoses, or does it operate as an opaque system?
- Topology Integration: Does it automatically discover and maintain service dependencies across hybrid and multi-cloud environments?
- Ecosystem Compatibility: Can it connect directly with your team's existing ChatOps, alerting, and ITSM tooling?
- Automation Security & Guardrails: Does it offer granular role-based access control (RBAC), rate-limiting mechanisms, and approval gates for automated actions?
- Time-to-Value: How long does the engine require to train its models before providing meaningful alert reduction?
- Deployment Flexibility: Can the solution run securely in private VPC environments or on-premises to meet data privacy regulations?
- Cost Predictability: Is pricing tied to data ingestion volume, host counts, or user seats, and how does cost scale with system growth?
- Skills & Educational Readiness: Does your team possess the skills needed to maintain the platform, or will you require dedicated training resources?
Leveraging technical education platforms like TheAIOps helps bridge team skill gaps, enabling organizations to effectively design, evaluate, and manage modern AIOps solutions.
Practical Takeaways
- Decouple Ingestion from Processing: Standardize telemetry collection with OpenTelemetry before sending data to analytical pipelines.
- Focus First on Signal Noise: Target initial implementation efforts on alert deduplication and dynamic thresholding before attempting fully automated remediation.
- Leverage Topology for Causality: Ensure the analytical engine uses dynamic dependency maps to accurately correlate events across microservices.
- Enforce Automation Guardrails: Always apply strict rate limits, approval gates, and rollback policies to automated response playbooks.
- Keep Engineers in the Loop: Treat machine learning outputs as decision-support insights that empower—rather than replace—skilled engineers.
Frequently Asked Questions (FAQs)
What defines a modern AIOps architecture?
An AIOps architecture is the structural design of a system that ingests multi-source operational telemetry, processes it using machine learning models, isolates true performance anomalies, and integrates with incident workflows and automated runbooks.
How does an AIOps architecture differ from traditional monitoring setups?
Traditional monitoring tools rely on isolated telemetry silos and static alerting thresholds. An AIOps architecture unifies metrics, logs, traces, and dynamic topology maps, applying machine learning to reduce alert noise and accelerate root-cause analysis.
What are the core layers of an AIOps platform?
A standard architecture comprises five decoupled layers: Ingestion & Streaming, Processing & Storage, Analytic ML Engine, Incident Management, and Policy-Governed Automation.
Can an AIOps architecture be built using open-source tools?
Yes. Many organizations construct custom AIOps pipelines by combining OpenTelemetry for collection, Apache Kafka for event streaming, Prometheus and OpenSearch for storage, and custom Python ML services for analytical processing.
What is the role of OpenTelemetry in an AIOps architecture?
OpenTelemetry provides a vendor-neutral framework for generating, enriching, and exporting traces, metrics, and logs. It serves as a standardized ingestion tier that feeds clean data into downstream ML pipelines.
How does topology data improve event correlation?
Topology mapping provides structural context. By understanding how components connect, the ML engine can accurately trace downstream error cascades back to the originating root component.
What is the difference between static thresholds and dynamic baselines?
Static thresholds trigger alerts when metrics cross a fixed value (e.g., CPU > 80%). Dynamic baselines use machine learning to calculate normal operational ranges based on historical patterns, accounting for daily traffic variance and scheduled workloads.
How do governance guardrails protect automated remediation?
Guardrails enforce safety boundaries—such as rate limits, scope restrictions, and mandatory human approval gates—preventing automated workflows from causing unintended system disruptions.
How can operations teams prepare to adopt an AIOps architecture?
Teams should focus on standardizing log formats, adopting OpenTelemetry, and refining observability standards. Resources like TheAIOps offer educational guides and practical frameworks to support this transition.
Is generative AI used in modern AIOps architectures?
Yes. Modern platforms incorporate Large Language Models (LLMs) to construct human-readable incident summaries, query complex log sets using natural language, and generate draft diagnostic runbooks for engineering review.
Conclusion
Building a modern AIOps architecture empowers IT organizations to transform high-velocity telemetry streams into actionable operational intelligence. By pairing standardized ingestion with dynamic machine learning algorithms and policy-governed automation, platform teams can eliminate alert fatigue, shorten resolution times, and maintain service availability across complex environments.
Long-term success requires clean telemetry standards, real-time dependency mapping, explicit automation controls, and continuous skill development. Educational platforms like TheAIOps provide the technical resources, guidance, and training frameworks engineers need to successfully implement and manage Artificial Intelligence for IT Operations.






Top comments (0)