Product Vision
Life Grid aims to give people a fresh perspective on their life’s timeline. By turning years, months, or weeks into a visual grid, it helps users reflect on how much time they’ve already lived, how much remains (based on their expected lifespan), and how best to use that time. The goal is not just awareness but motivation — to live more intentionally.
Who It’s For
- Individuals reflecting on life direction and priorities
- Goal-setters who want to plan long-term with awareness of their time horizon
- People fighting procrastination and seeking urgency
- Coaches or mentors guiding others in time / life planning
- Anyone curious & mindful about how their time allocations align with their values
Key Features & Inputs
| Feature | Description |
|---|---|
| Current Age & Expected Lifespan | You enter how old you are now, and how long you expect to live; this sets the frame. |
| Optional Birth Date | Adds precise calculation of days/weeks/months lived. |
| Flexible Time Units | Weeks, months, or years — users can switch views to get different granularity. |
| Visual Grid Representation | A grid of squares showing passed vs. remaining units makes time more tangible. |
| Download & Share | Users can download the Life Grid as an image; share it for reflection or social motivation. |
| Privacy by Design | All work happens locally in the browser; no data is stored on servers. |
Use Cases
- Life Planning & Major Milestones — Map out career transitions, retirement, bucket list items within your remaining time.
- Goal Prioritization — Decide what really matters now vs. later, based on how much time is available.
- Motivation & Mental Models — Use the visual grid as a reminder, to reduce procrastination and build momentum.
- Reflection & Mindfulness — Periodic check-ins: Reflect on what’s been lived and what’s yet to come.
- Teaching & Workshops — Useful in workshops or coaching where visualizing time helps understand life choices and priorities.
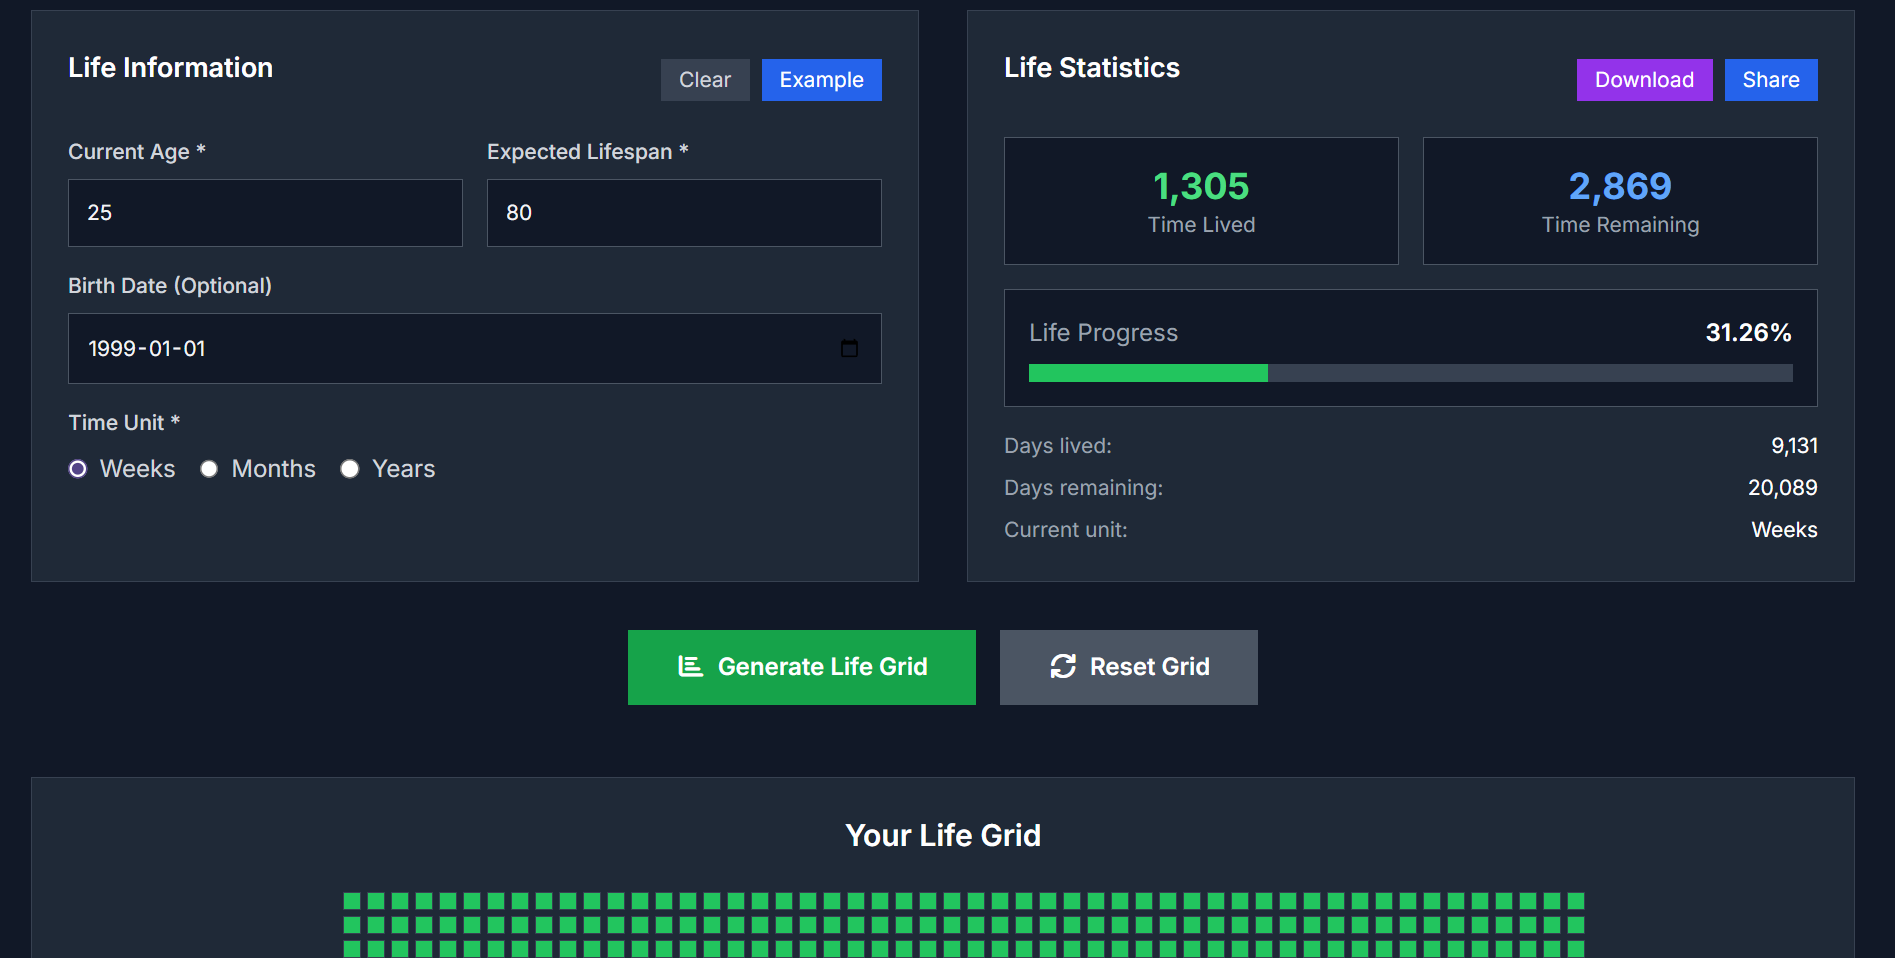
How It Works (User Workflow)
- Input your current age and your expected lifespan; optionally your birth date.
- Choose the time unit: weeks, months, or years.
- The tool computes how many units you’ve lived, how many units remain, and what proportion of life has passed.
- A grid is displayed: each square = one time unit. Passed units are visually distinguished from remaining.
- You can download the grid image, share, or reset and adjust to new inputs (for example if your expected lifespan changes).
Strategic Value & Differentiation
- Visualization over numbers: Seeing squares rather than just percentages creates intuitive understanding and emotional engagement.
- Flexibility in units gives both big‐picture view (years) and finer granularity (weeks) depending on purpose.
- Completely free and privacy-focused, which lowers friction for users to try and explore.
- Inspirational, not prescriptive: It doesn’t assume how you “should” live, but invites you to reflect and decide for yourself.
Success Metrics (Product KPIs)
- User engagement: how many users generate a Life Grid, download it, share it.
- Retention: do users come back after some months to re-visualize or update (as age or life goals change)?
- Feedback: are users inspired, feel more focused / intentional after using it?
- Conversion / reach: how many new users discover this tool via sharing, social media etc.
Try It Now
Experience clarity and reflection with your Life Grid: Life Grid
Top comments (0)